
Warren Buffett on the Market: The High Price of Optimism

The US stock market remains close to record highs, while market valuations continue to rise alongside the major indices. Against this backdrop, Warren Buffett has once again drawn attention to the line separating long-term investing from short-term bets on price movements.
In an interview with CNBC held during Berkshire Hathaway’s annual shareholders’ meeting, Buffett compared the modern market to a church with a casino attached to it. The ability to trade rapidly and bet on short-term price movements has, in his view, become more attractive to many market participants than analysing the underlying business. This was not a direct prediction of an imminent market crash. Buffett’s main warning was that speculative behaviour can push the prices of many assets to levels that are difficult to justify through fundamentals.
Several valuation indicators for the US market support this cautious view. The so-called Buffett Indicator, which compares the total market capitalisation of publicly traded US companies with the size of the economy, remains in an extreme range. Based on first-quarter data, one version of the indicator reached 218.1%. More timely estimates incorporating current market capitalisation approached 233% of GDP in late July. These levels are significantly above those observed during most previous market cycles.
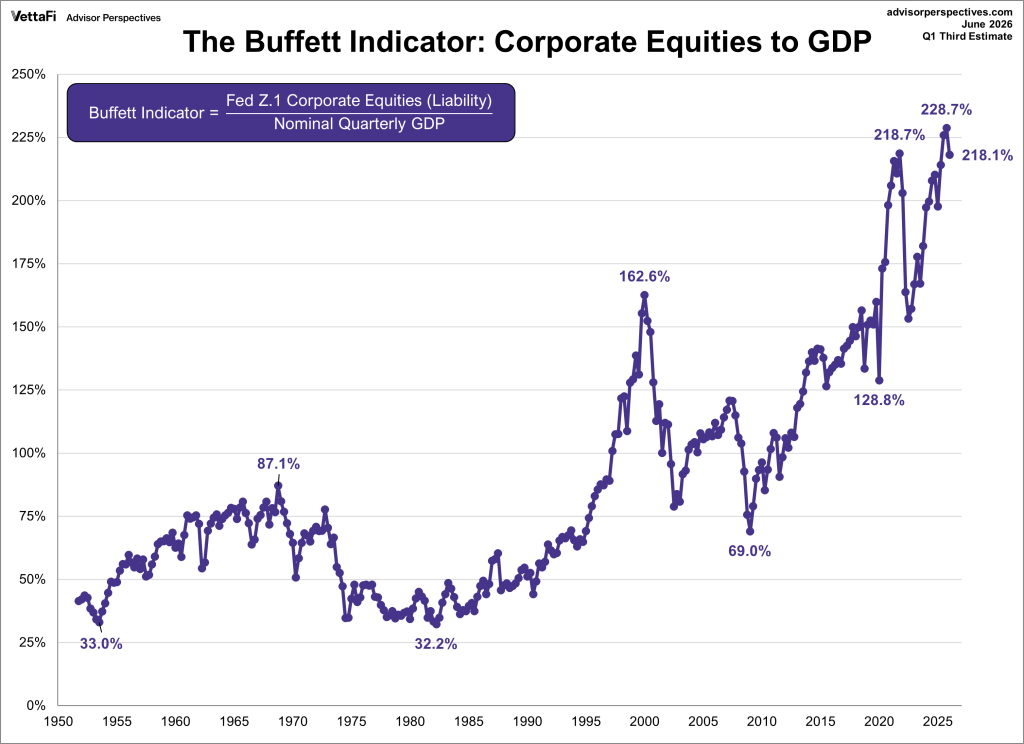
Buffett Indicator: US Stock Market Capitalisation to GDP, %
Source: Advisor Perspectives
Elevated valuations are also reflected in the Shiller CAPE ratio, which compares the current level of the S&P 500 with the average inflation-adjusted earnings of the companies in the index over the previous ten years. In late July, the ratio stood at around 41.4, approaching its historical high of 44.2, recorded at the peak of the dot-com bubble in 2000.
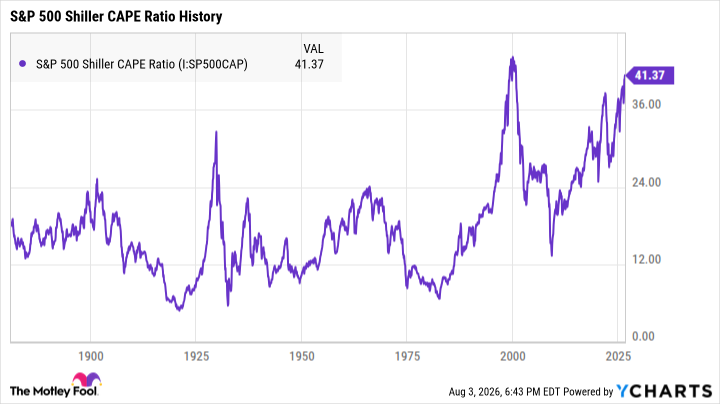
Shiller CAPE for the S&P 500
Source: Robert Shiller, Yale University; YCharts.
However, high readings in these indicators do not necessarily mean that the market is about to decline. Neither the Buffett Indicator nor the CAPE ratio is well suited to identifying the precise timing of a market reversal. An expensive market can remain expensive for an extended period, particularly when corporate earnings continue to grow and investor optimism remains strong.
Rather, such readings suggest that future returns may fall below their historical average and that share prices could react more sharply to disappointing corporate results, an economic slowdown or changes in interest rates.
The history of the dot-com bubble also shows that the consequences of high valuations are distributed unevenly across companies. Many businesses whose valuations were driven primarily by expectations never recovered after the crash. At the same time, some companies with sustainable business models, growing revenues and the ability to generate cash flow continued to develop and eventually regained their positions.
Buffett’s warning should therefore be viewed not as a call to leave the market entirely, but as a reminder that the cost of making a mistake has increased. The higher an asset’s valuation, the more its future performance depends on the company’s ability to meet the expectations already reflected in its share price.
In an expensive market, business quality, financial resilience, cash generation, a reasonable purchase price and a sufficiently long investment horizon become particularly important. The indices may continue to rise, but a strategy based solely on the expectation of further price gains increasingly resembles the very game against which Buffett is warning investors.